Designer Analysis
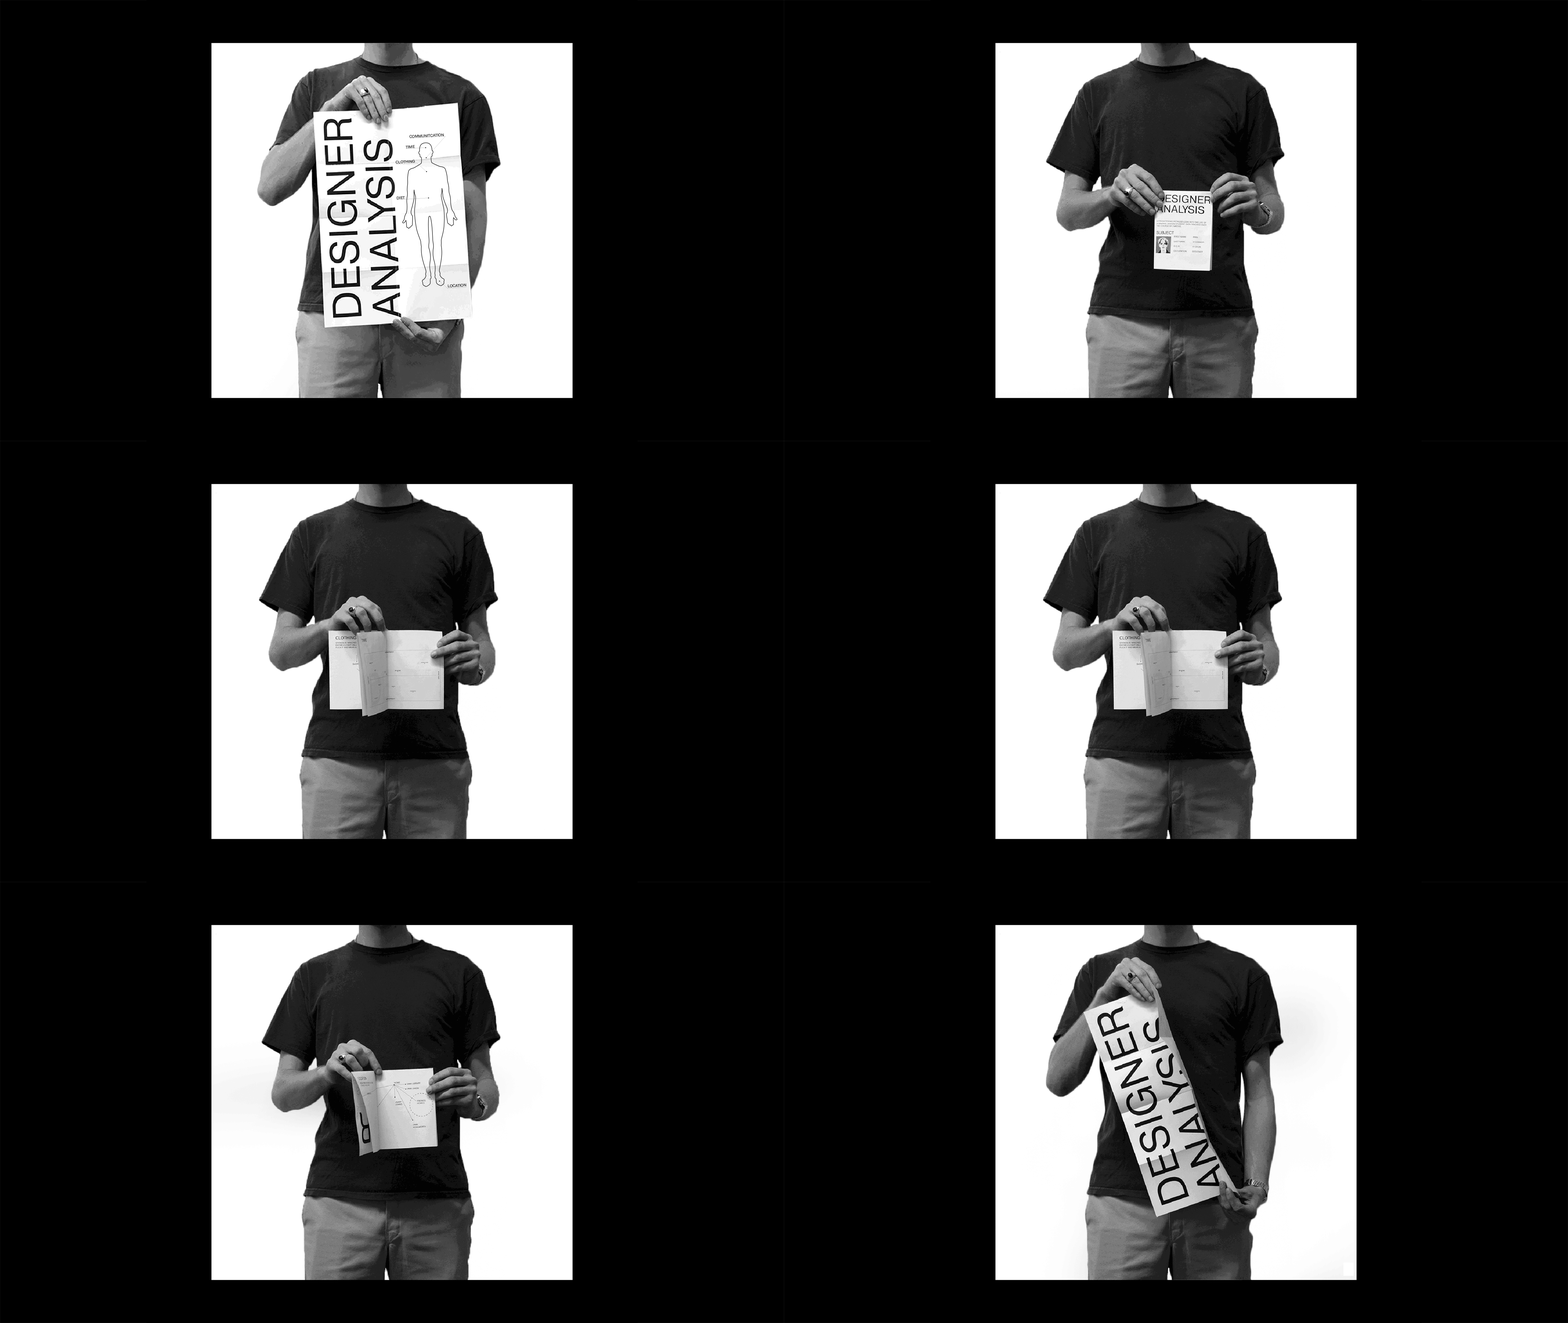
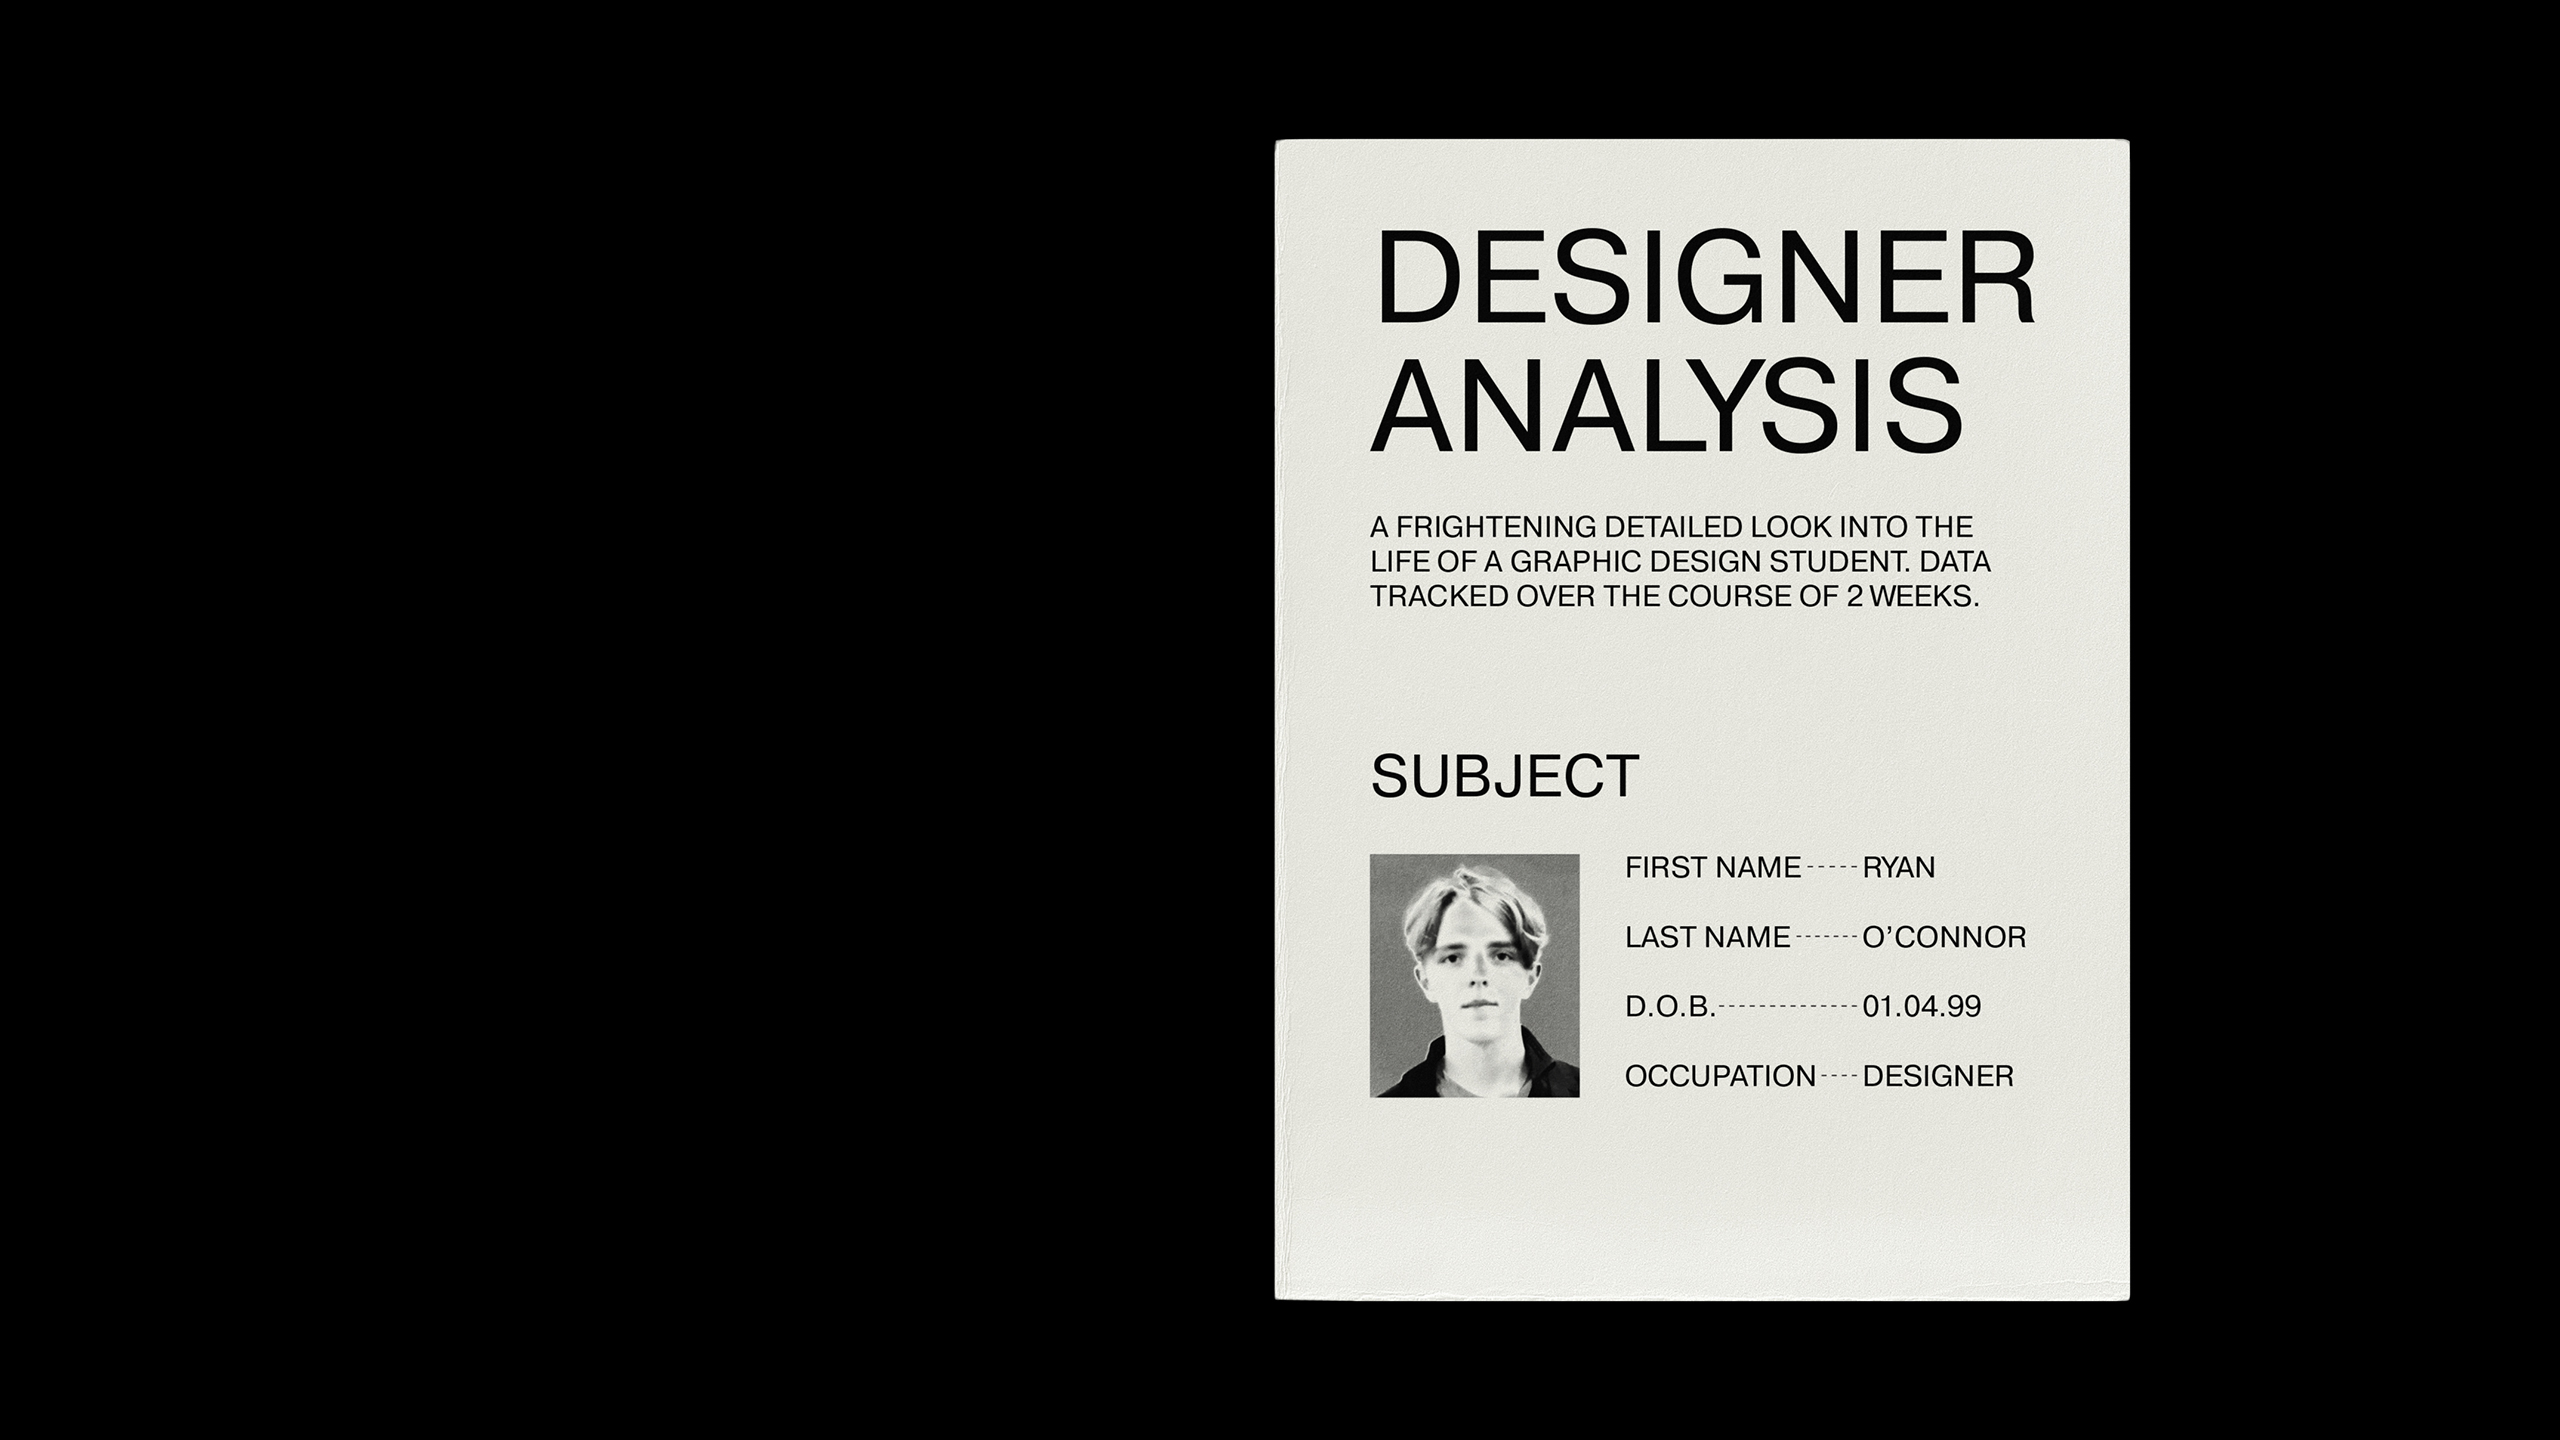
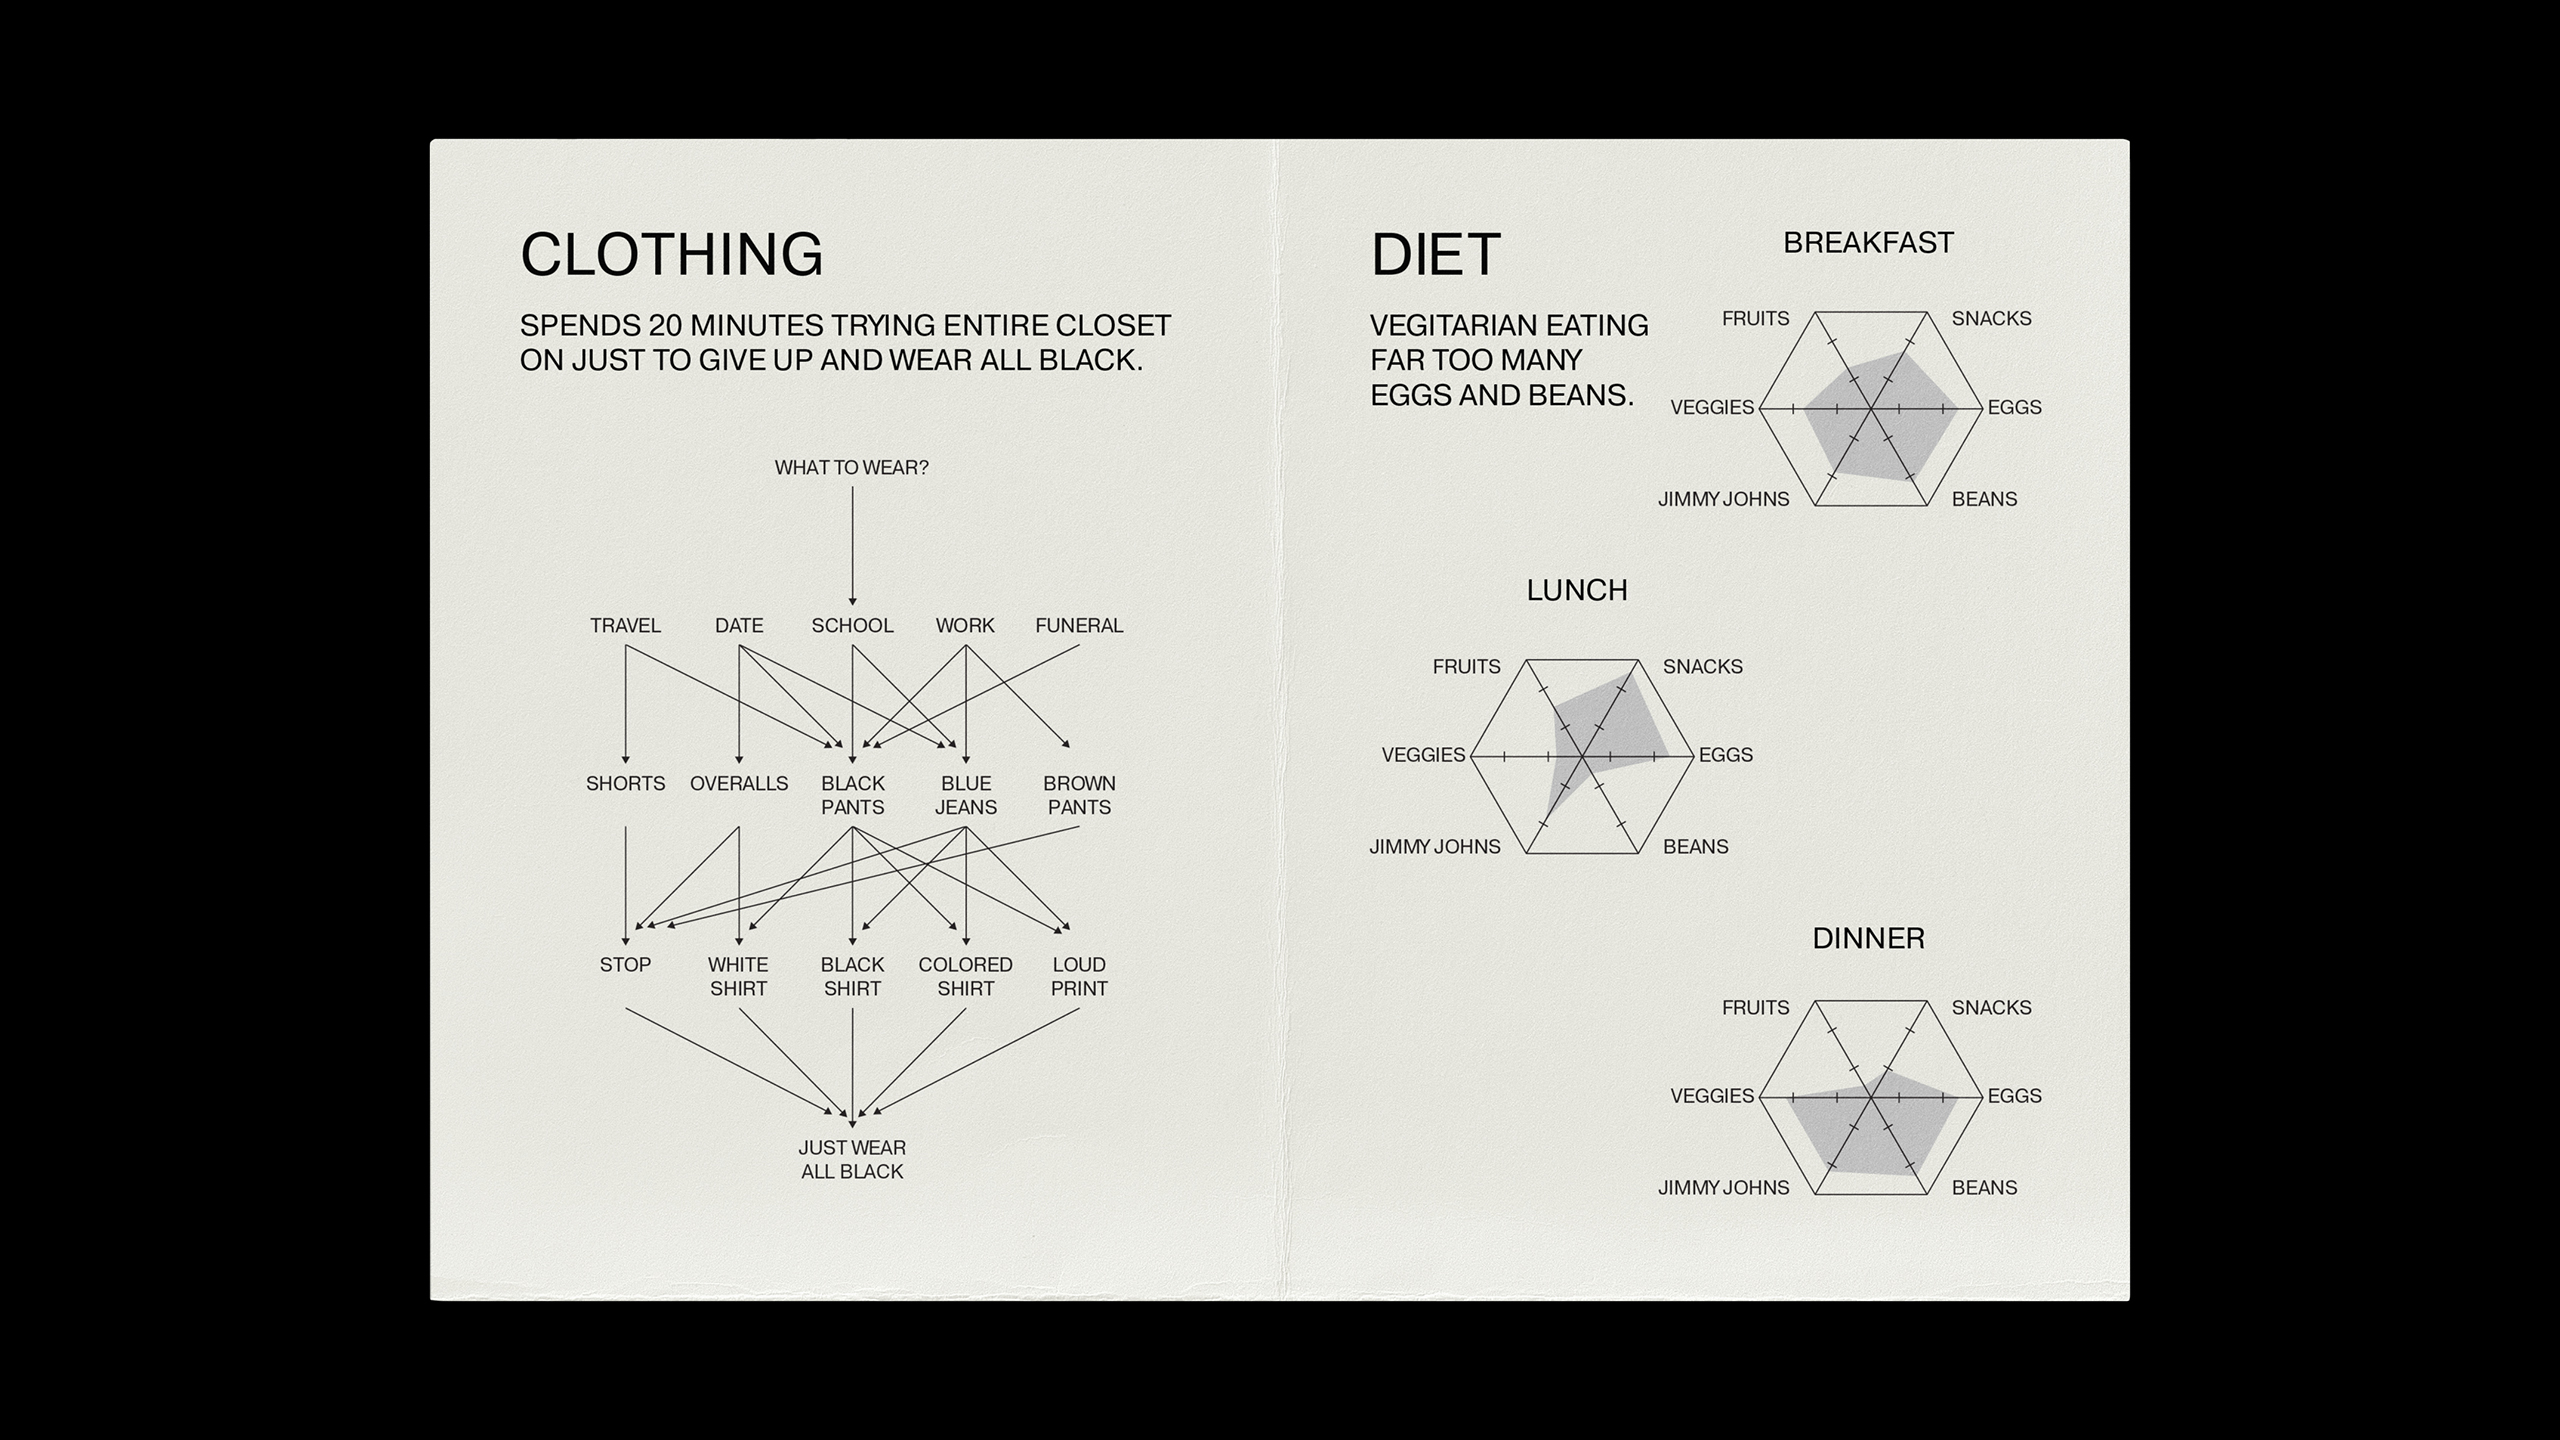
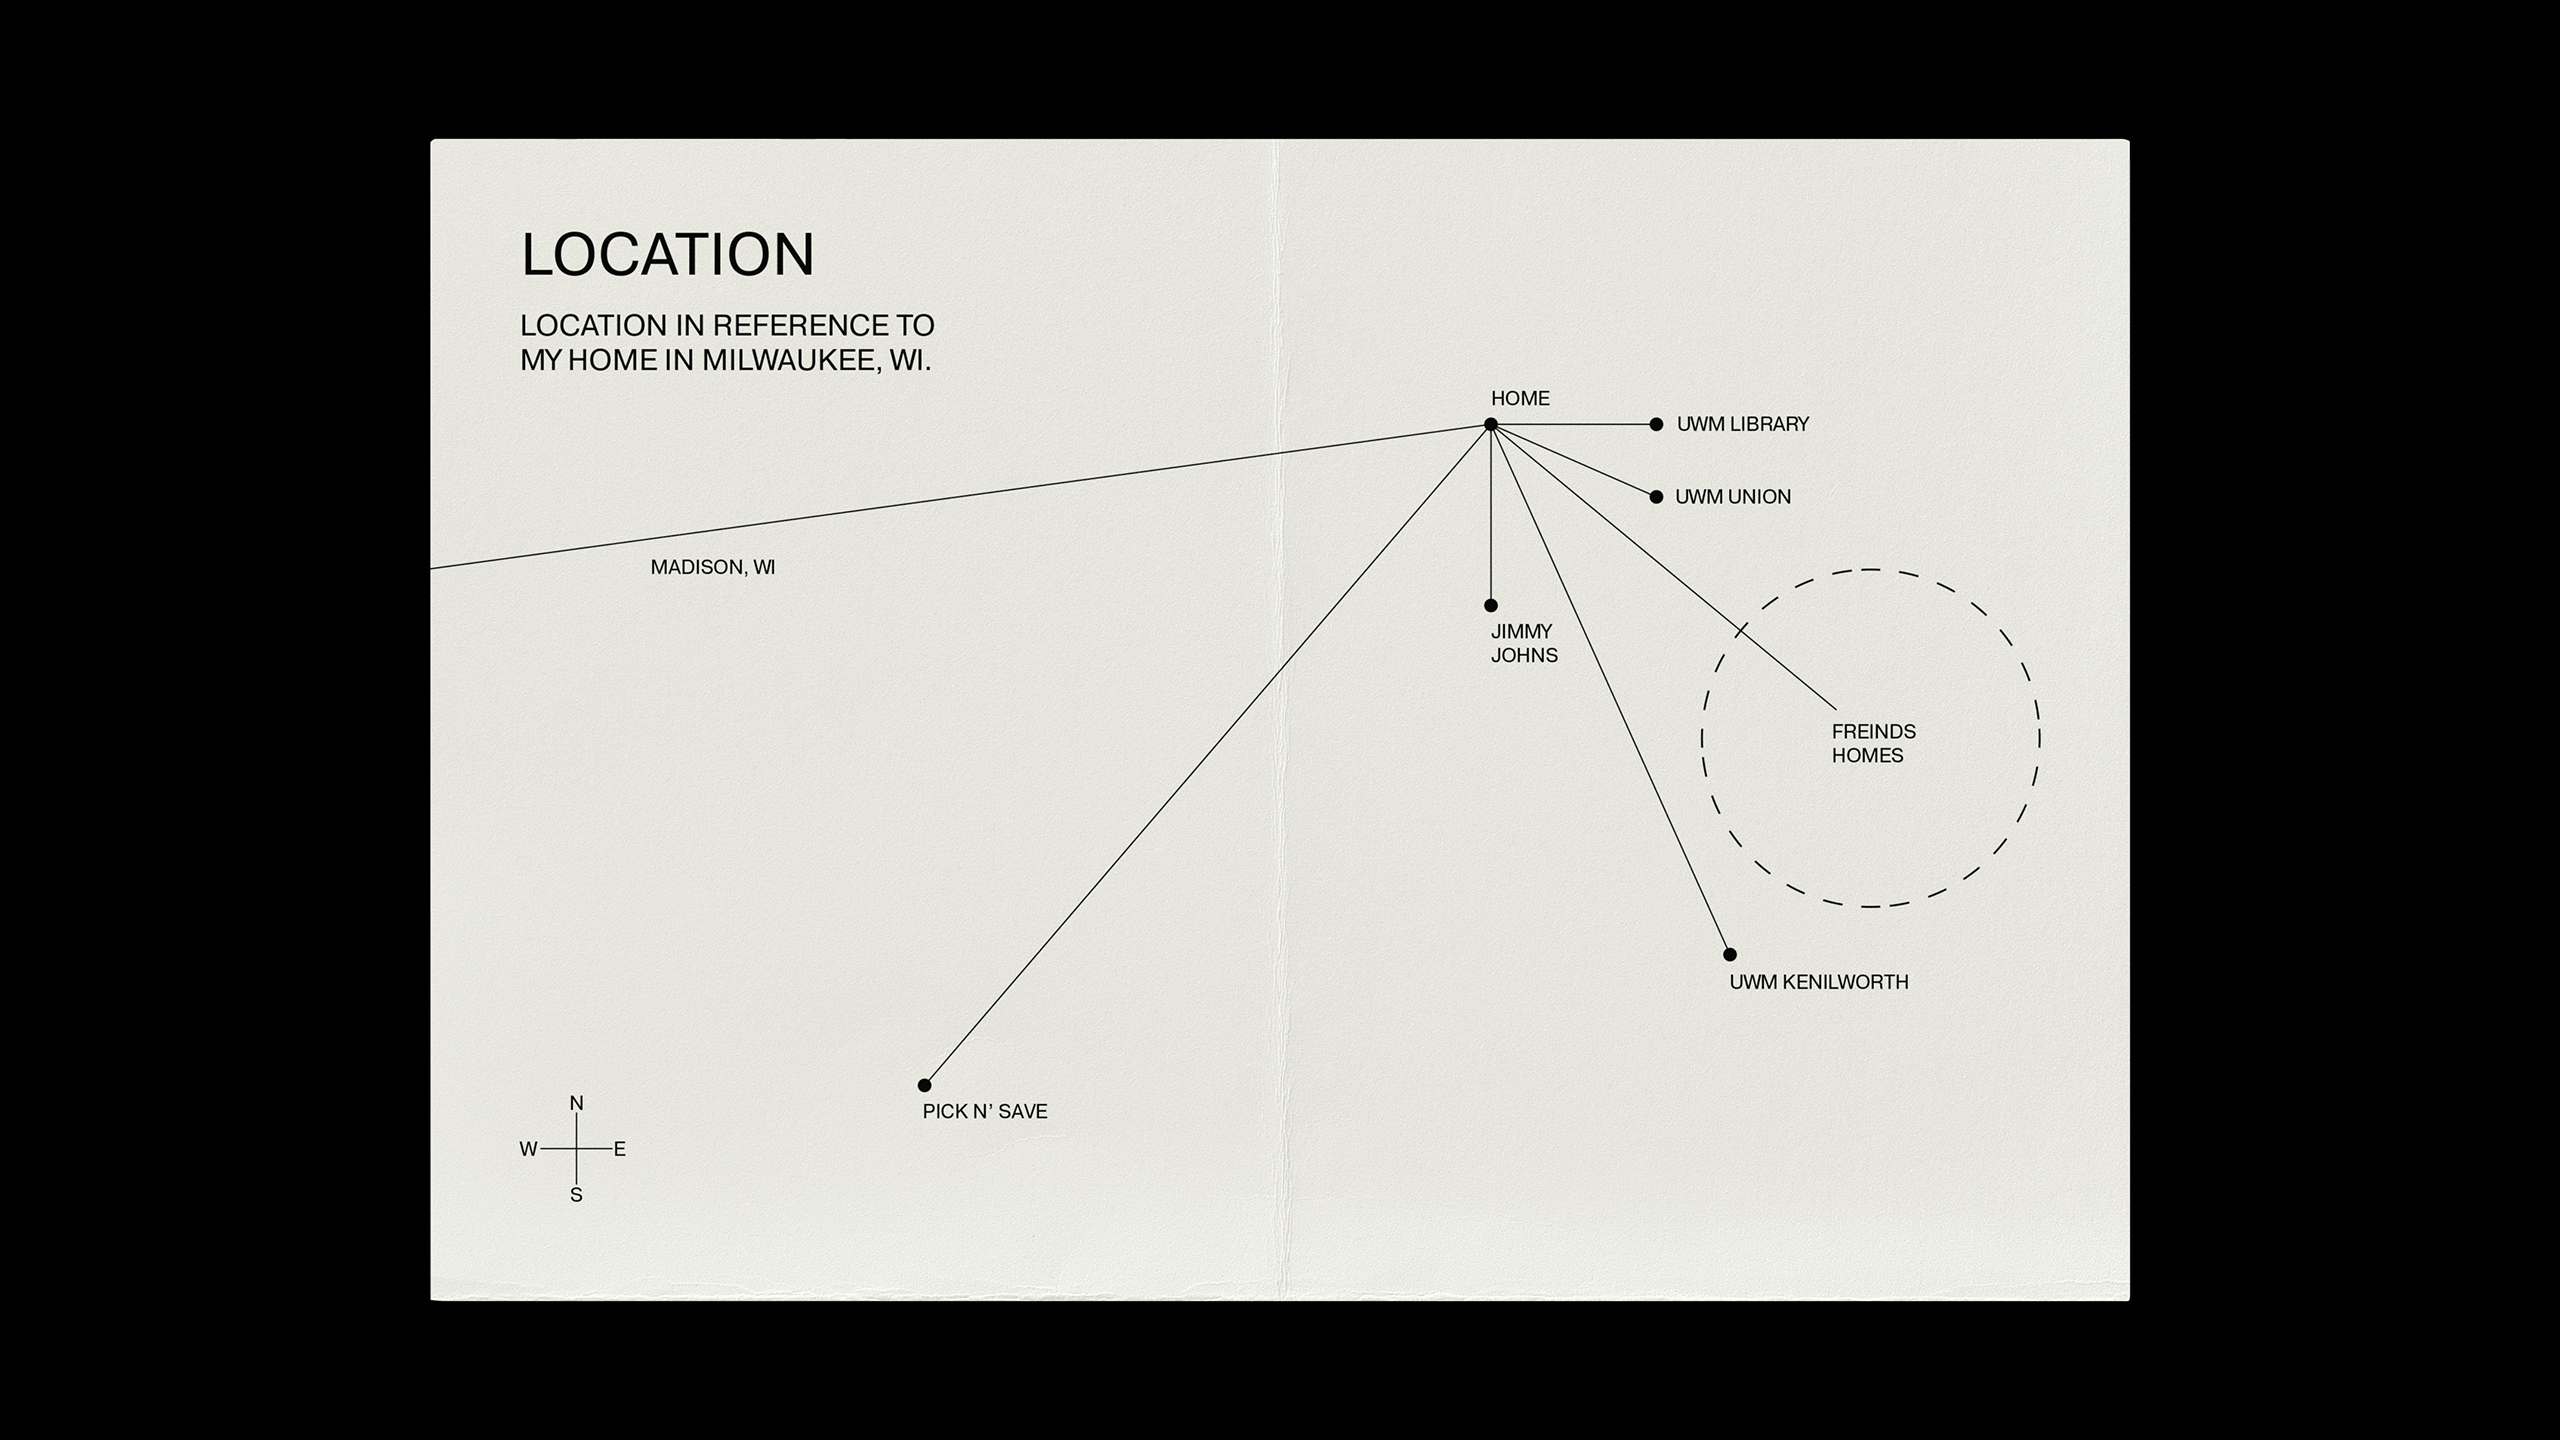
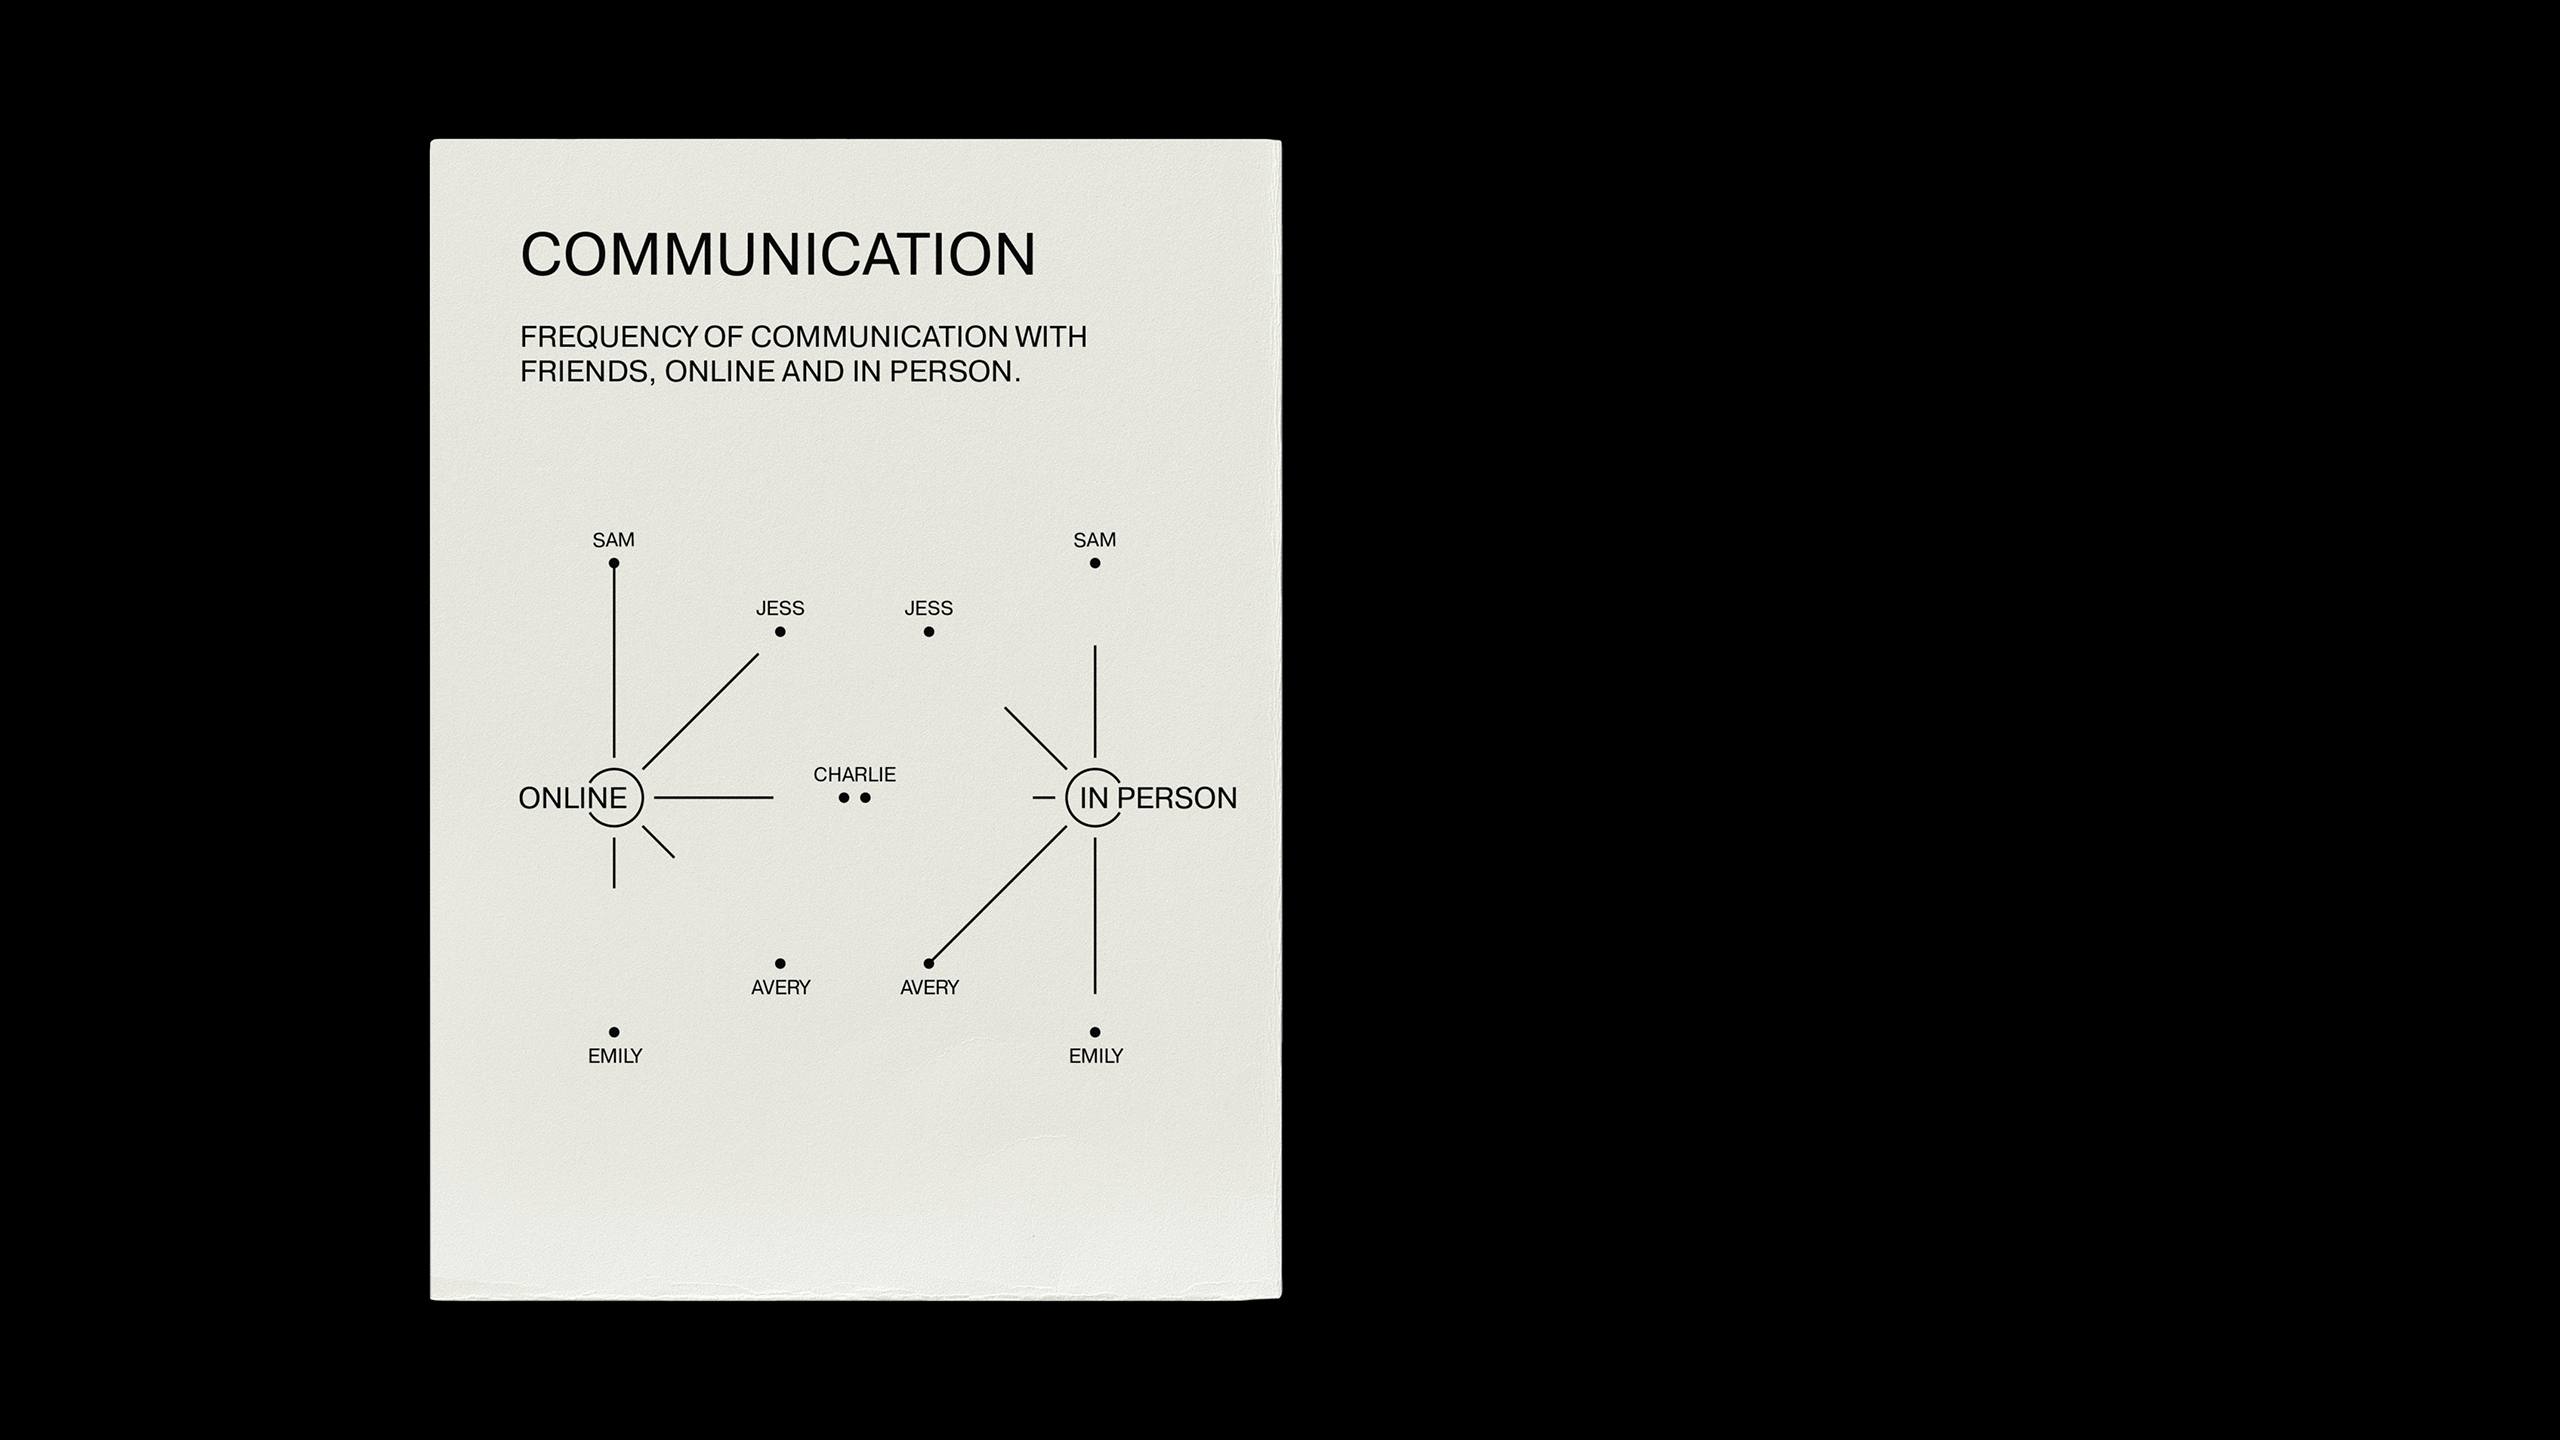
After a week's worth of meticulous data collecting, I created an infographic to illustrate my habits. This experiment in data visualization is an irreverent representation of my life told through the serious nature of government-style documents. The final product is a tactile poster that folds into a small 8-page booklet.


